Project Overview
The Walmart Data Portal is an internal enterprise platform that serves as a single source of truth for Walmart’s vast data ecosystem. It enables data analysts, engineers, and business users to discover, explore, and understand data assets across applications, databases, and cloud environments. Key features include Data Store Catalog, Metadata Catalog, Data Lineage, Data Quality dashboards, Duplication Analysis, and detailed asset views with rich metadata.
Walmart generates an absurd amount of data across on-prem servers, cloud warehouses, and third-party tools. The Data Portal is the internal product that helps analysts, engineers, and governance teams figure out what data exists, where it lives, whether it’s any good, and how it all connects.
The Challenge
Users need to:
- Find the right table or database among 15,000+ applications and 124,000+ databases without digging through five different tools
- Know whether a dataset is trustworthy before they build a report on it
- Trace where data came from and where it’s going, especially when debugging pipeline breaks
- Spot duplicate tables across the organization so they’re not paying to store the same data twice
- Classify sensitive data (PII, biometric info, financial records) for compliance
Key challenges
Walmart’s data footprint is massive and spread across on-prem and cloud. Before this portal, lineage was basically a manual exercise—engineers would trace pipelines by reading code or asking around in Slack. Quality scores lived in Collibra but were disconnected from the actual tables. Duplication was invisible until someone accidentally found the same dataset in two places. And the existing interfaces were cluttered; people would open a catalog page and immediately bounce because it was too dense.
We also had two very different audiences. Data analysts want to search fast and move on. Governance teams want to filter by market, brand, functional group, and data category type. Building one search and navigation model that worked for both was tricky.
My Role
I was the IC designer on this from early sketches through delivery. I mapped out the information architecture, designed the left navigation, built the search experience, and laid out every dashboard and detail page. I worked directly with the engineering team to figure out what was feasible, and I ran weekly reviews with data governance stakeholders to make sure we weren’t designing something that looked nice but missed compliance requirements.
User Research
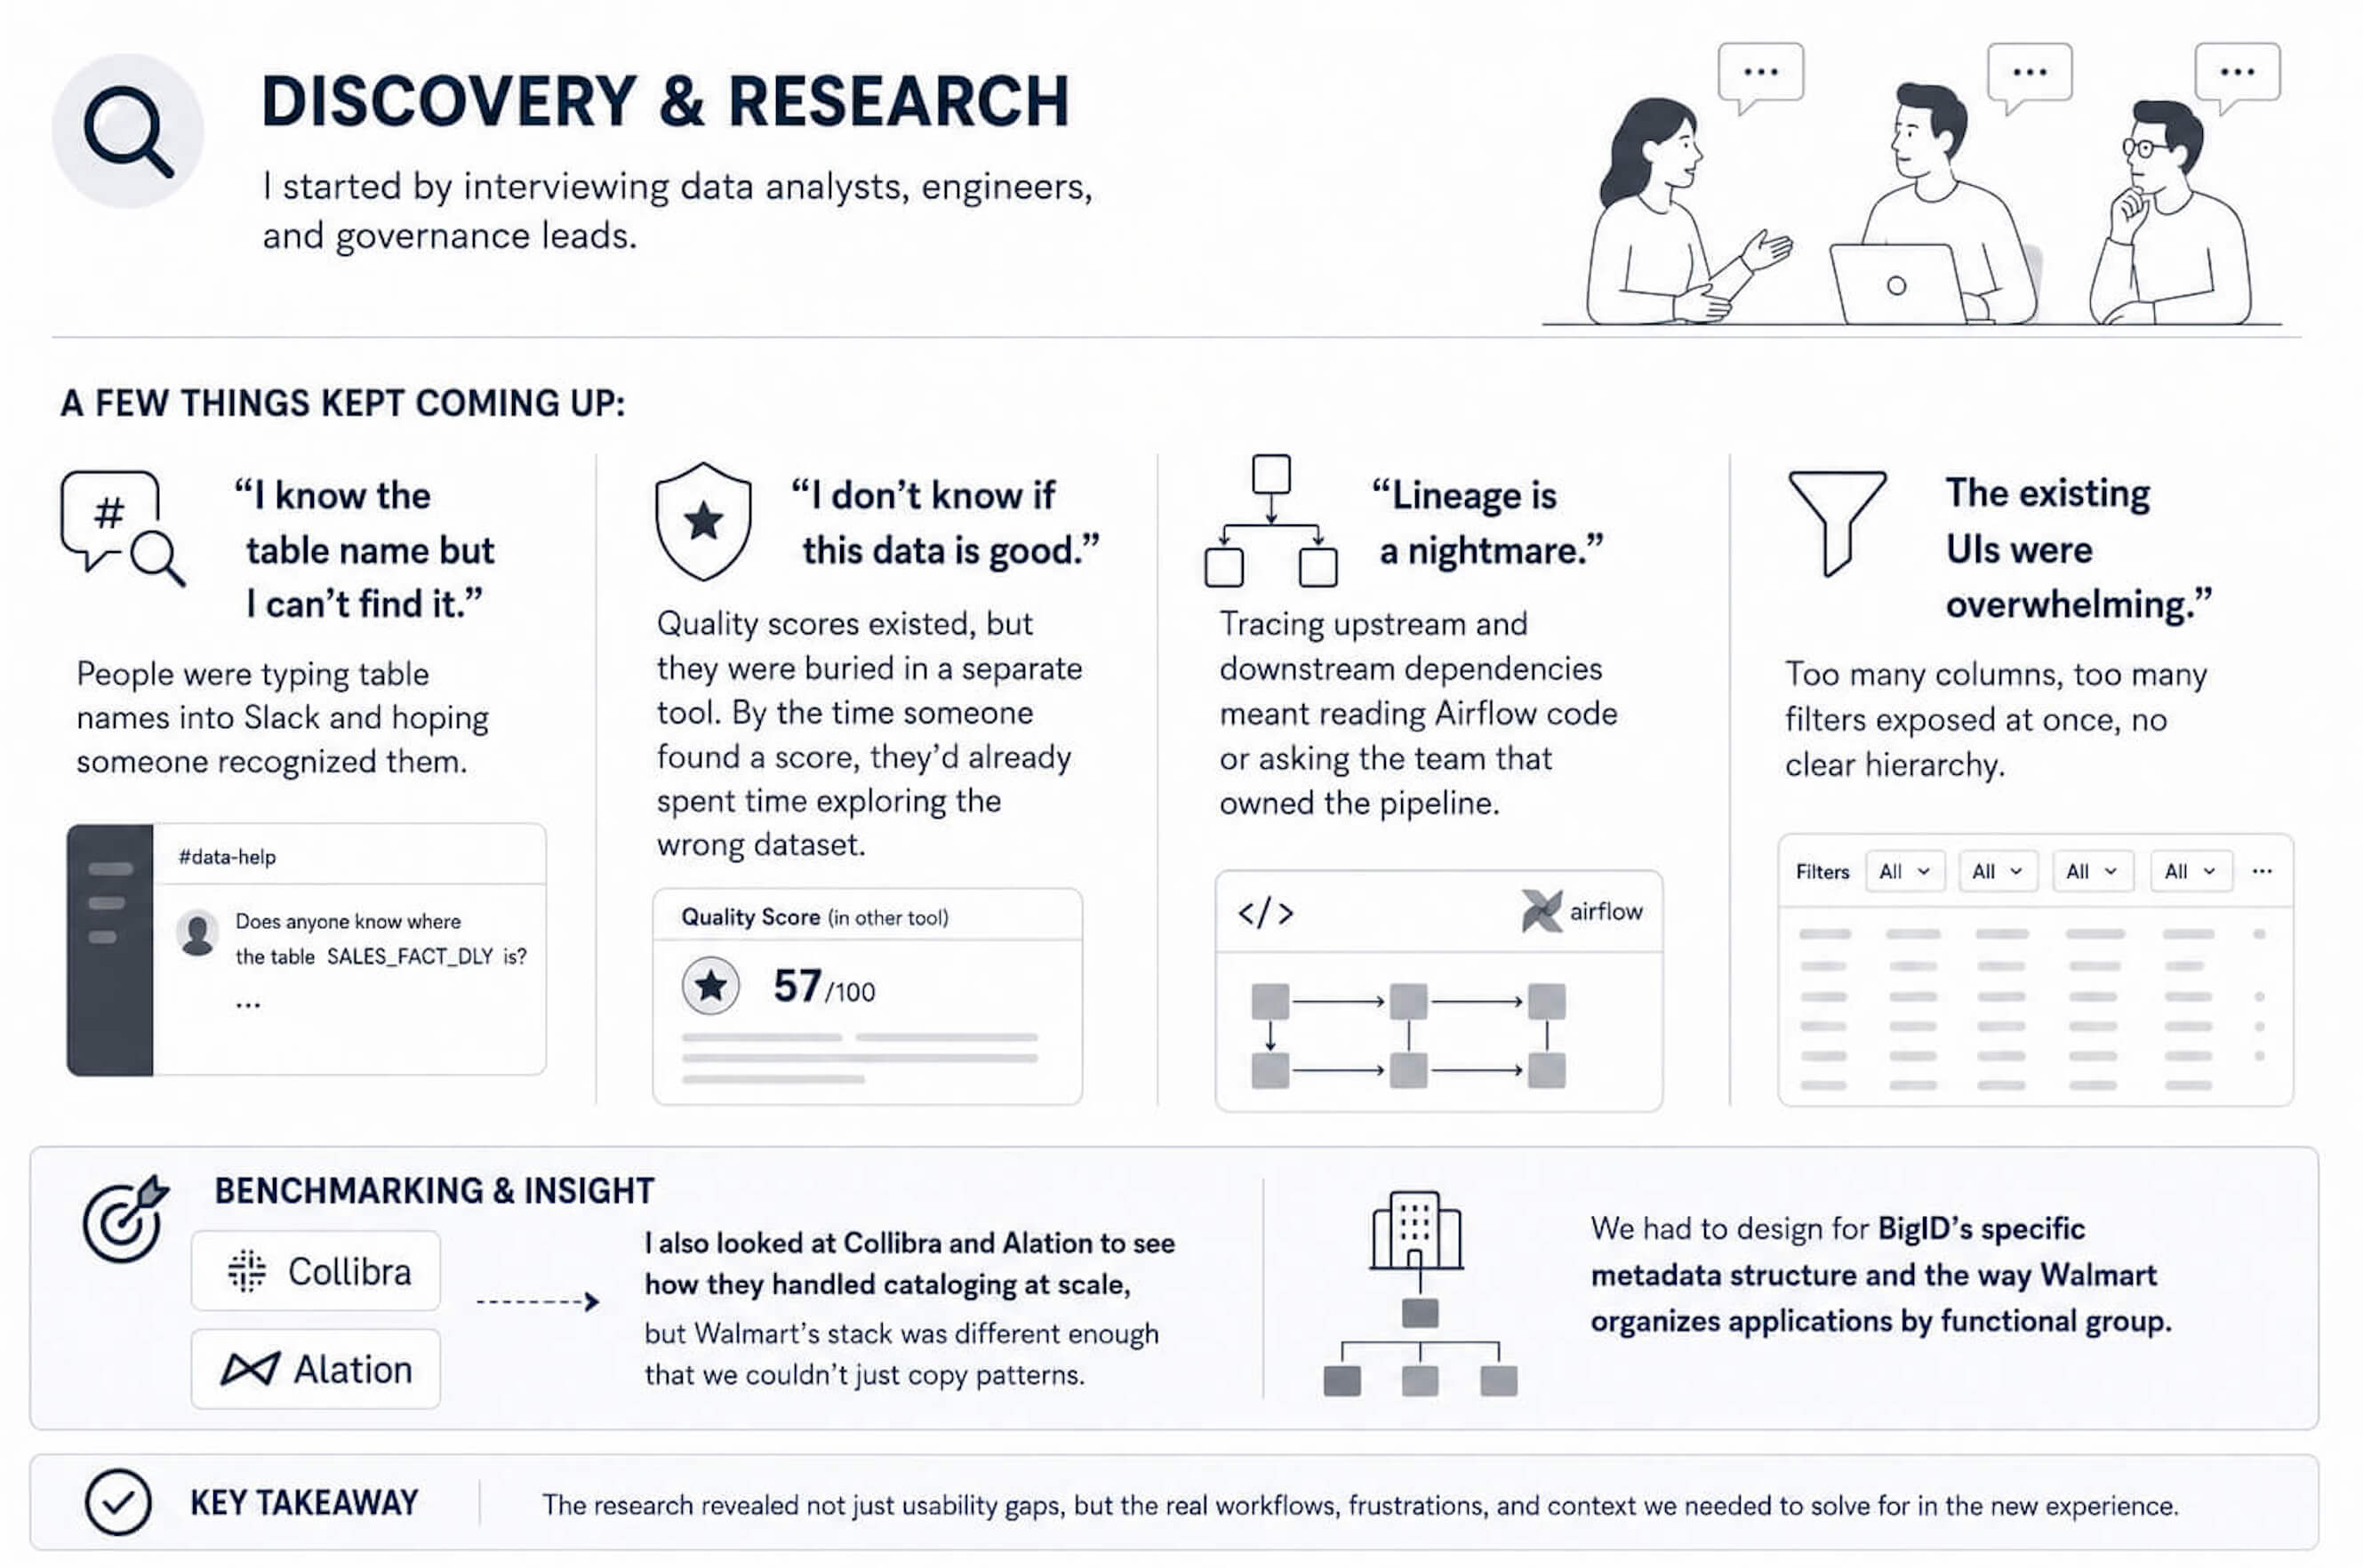
I started by interviewing data analysts, engineers, and governance leads. A few things kept coming up:
- "I know the table name but I can’t find it." People were typing table names into Slack and hoping someone recognized them.
- "I don’t know if this data is good." Quality scores existed, but they were buried in a separate tool. By the time someone found a score, they’d already spent time exploring the wrong dataset.
- "Lineage is a nightmare." Tracing upstream and downstream dependencies meant reading Airflow code or asking the team that owned the pipeline.
- The existing UIs were overwhelming. Too many columns, too many filters exposed at once, no clear hierarchy.
I also looked at Collibra and Alation to see how they handled cataloging at scale, but Walmart’s stack was different enough that we couldn’t just copy patterns. We had to design for BigID’s specific metadata structure and the way Walmart organizes applications by functional group.
The Solution
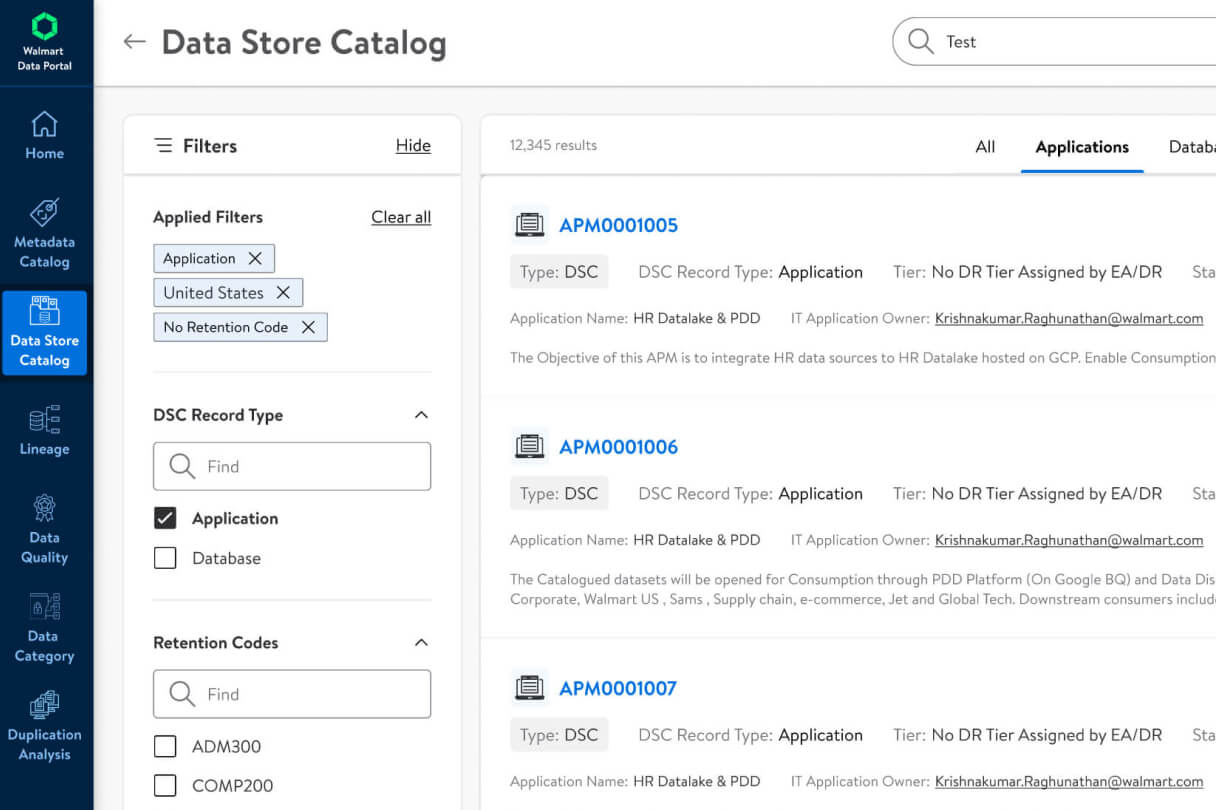
We built a single portal with a consistent left nav: Home, Data Store Catalog, Metadata Catalog, Lineage, Data Quality, Data Category, and Duplication Analysis.
- Homepage: I stripped it down to a personalized greeting (“Hi Amy,” “Hi Diana”), a prominent search bar with a “My Last Searches” section below it, and a grid of module cards that explain what each area does.
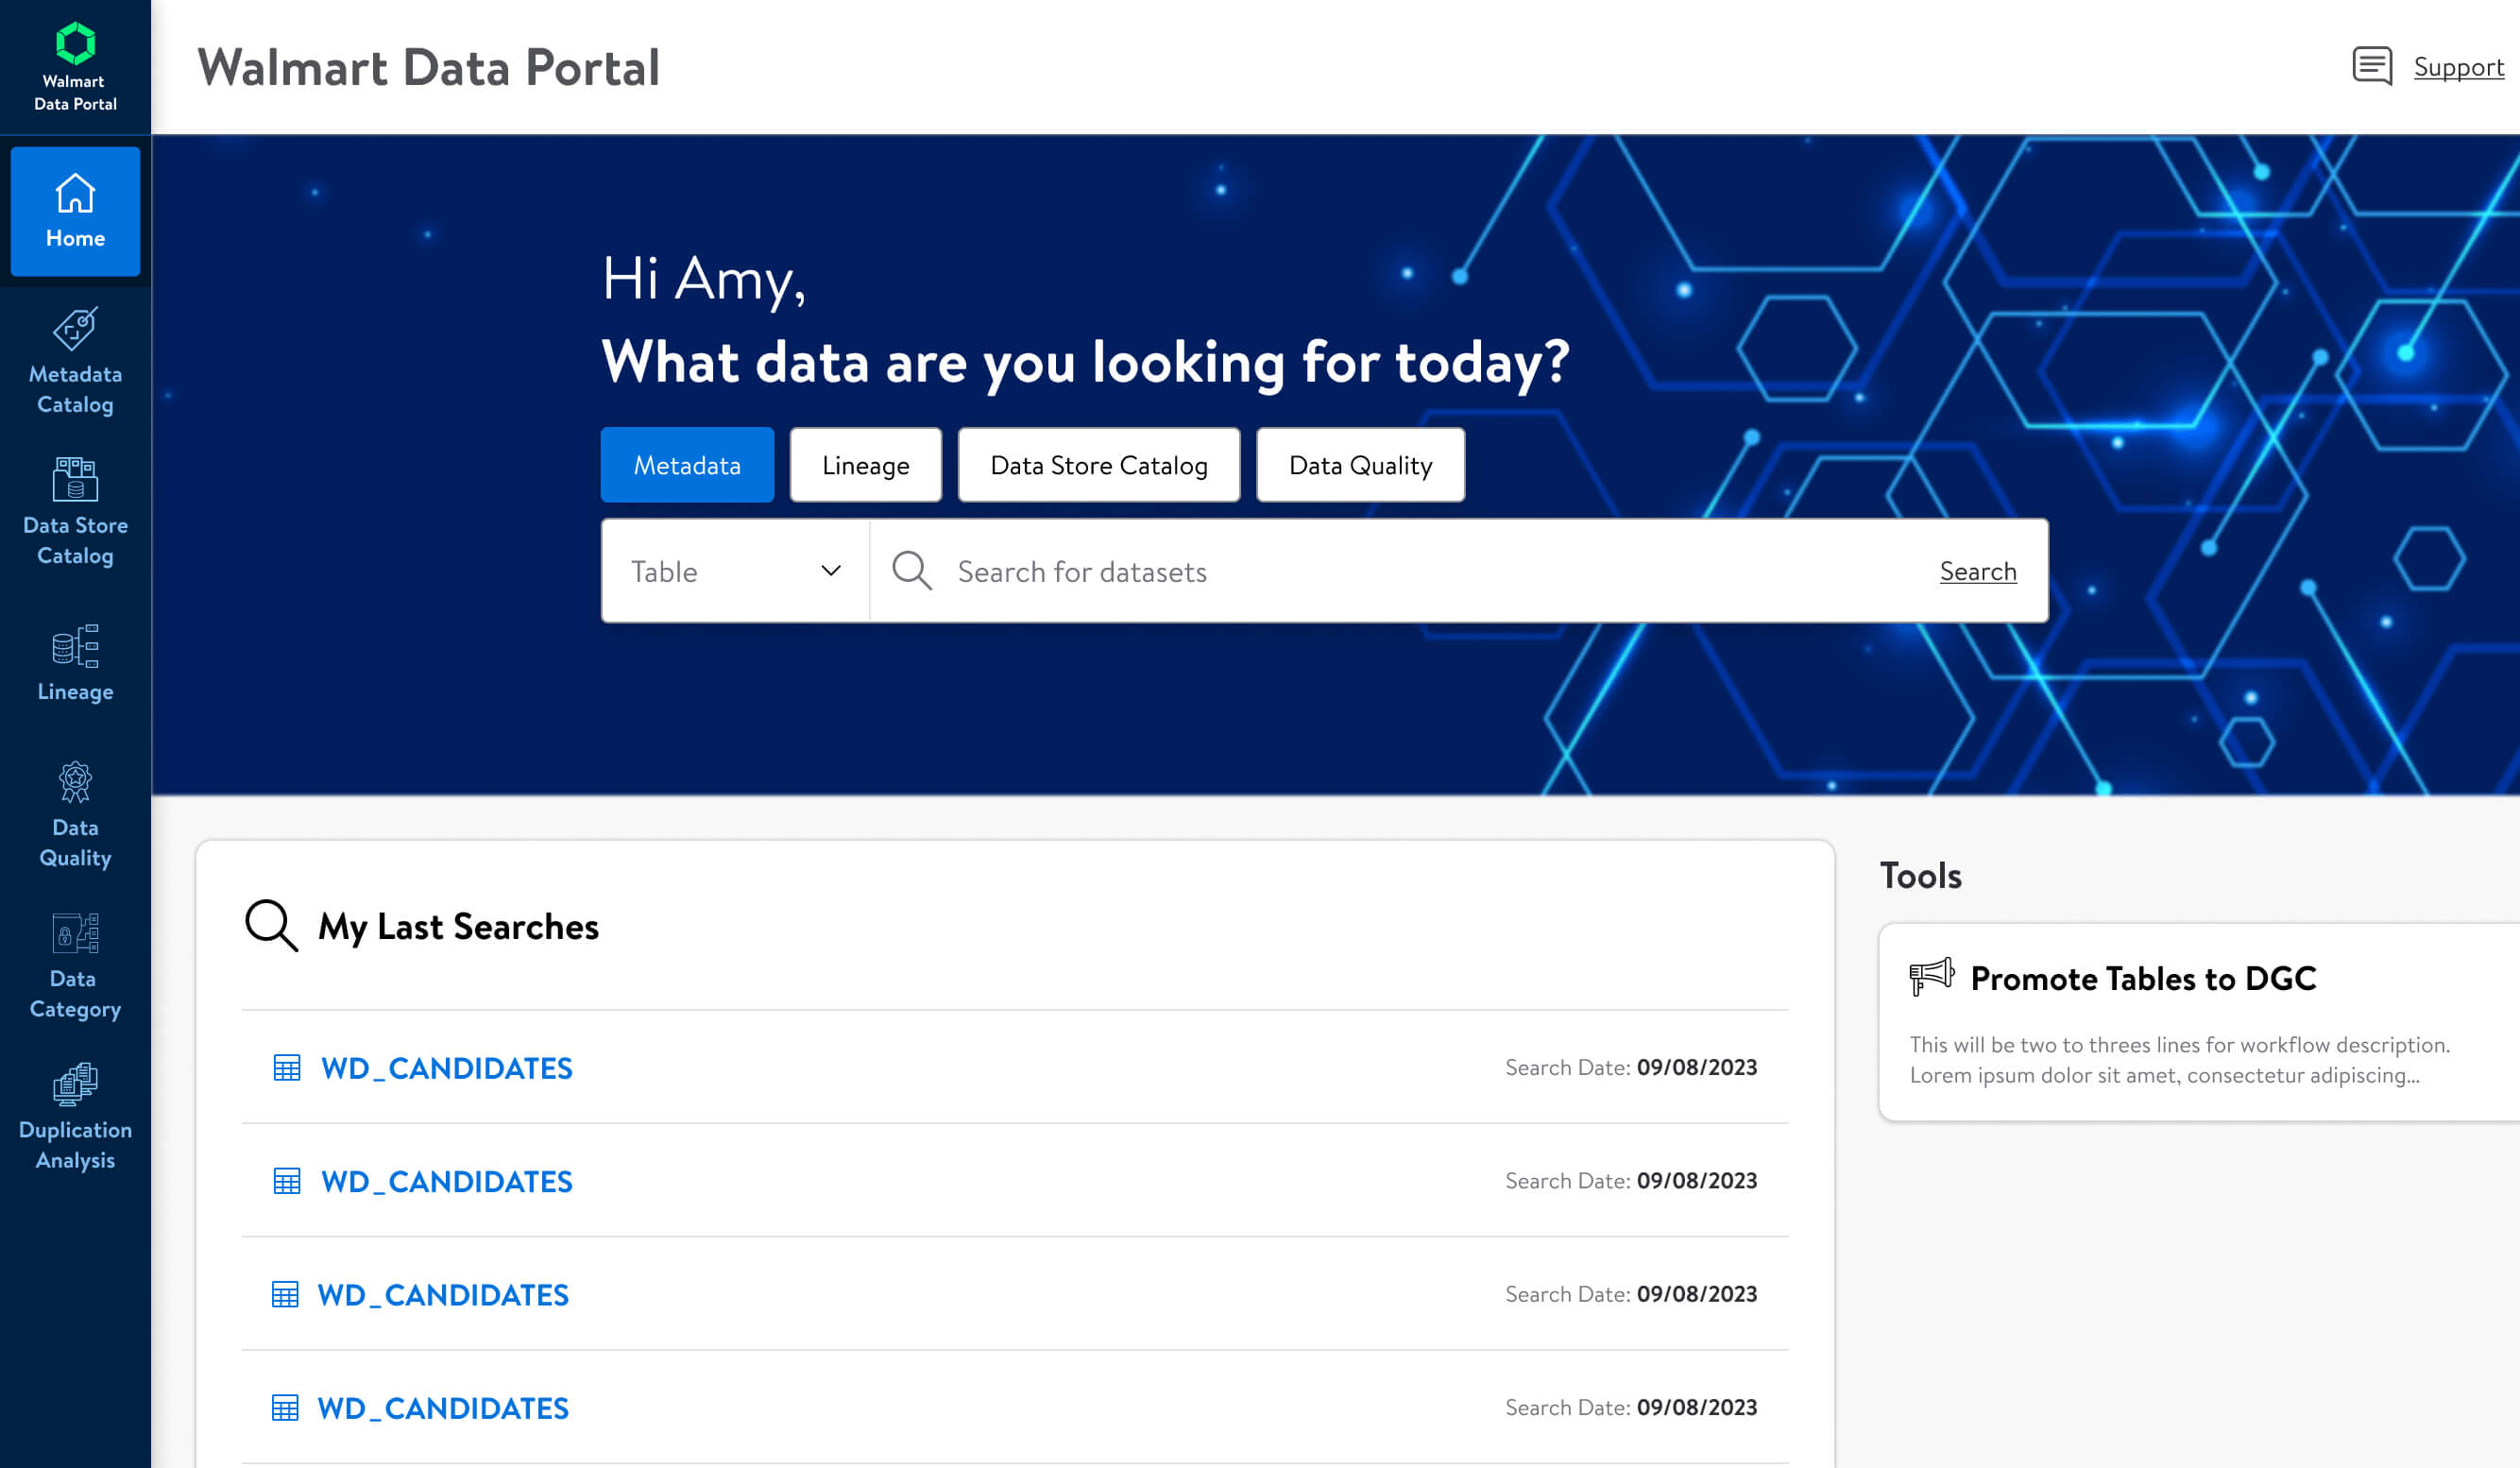
- Search: The search bar sits at the top of every page. It has a category dropdown (Metadata, Lineage, Data Store Catalog, Data Quality) so users can scope their search without learning advanced syntax.
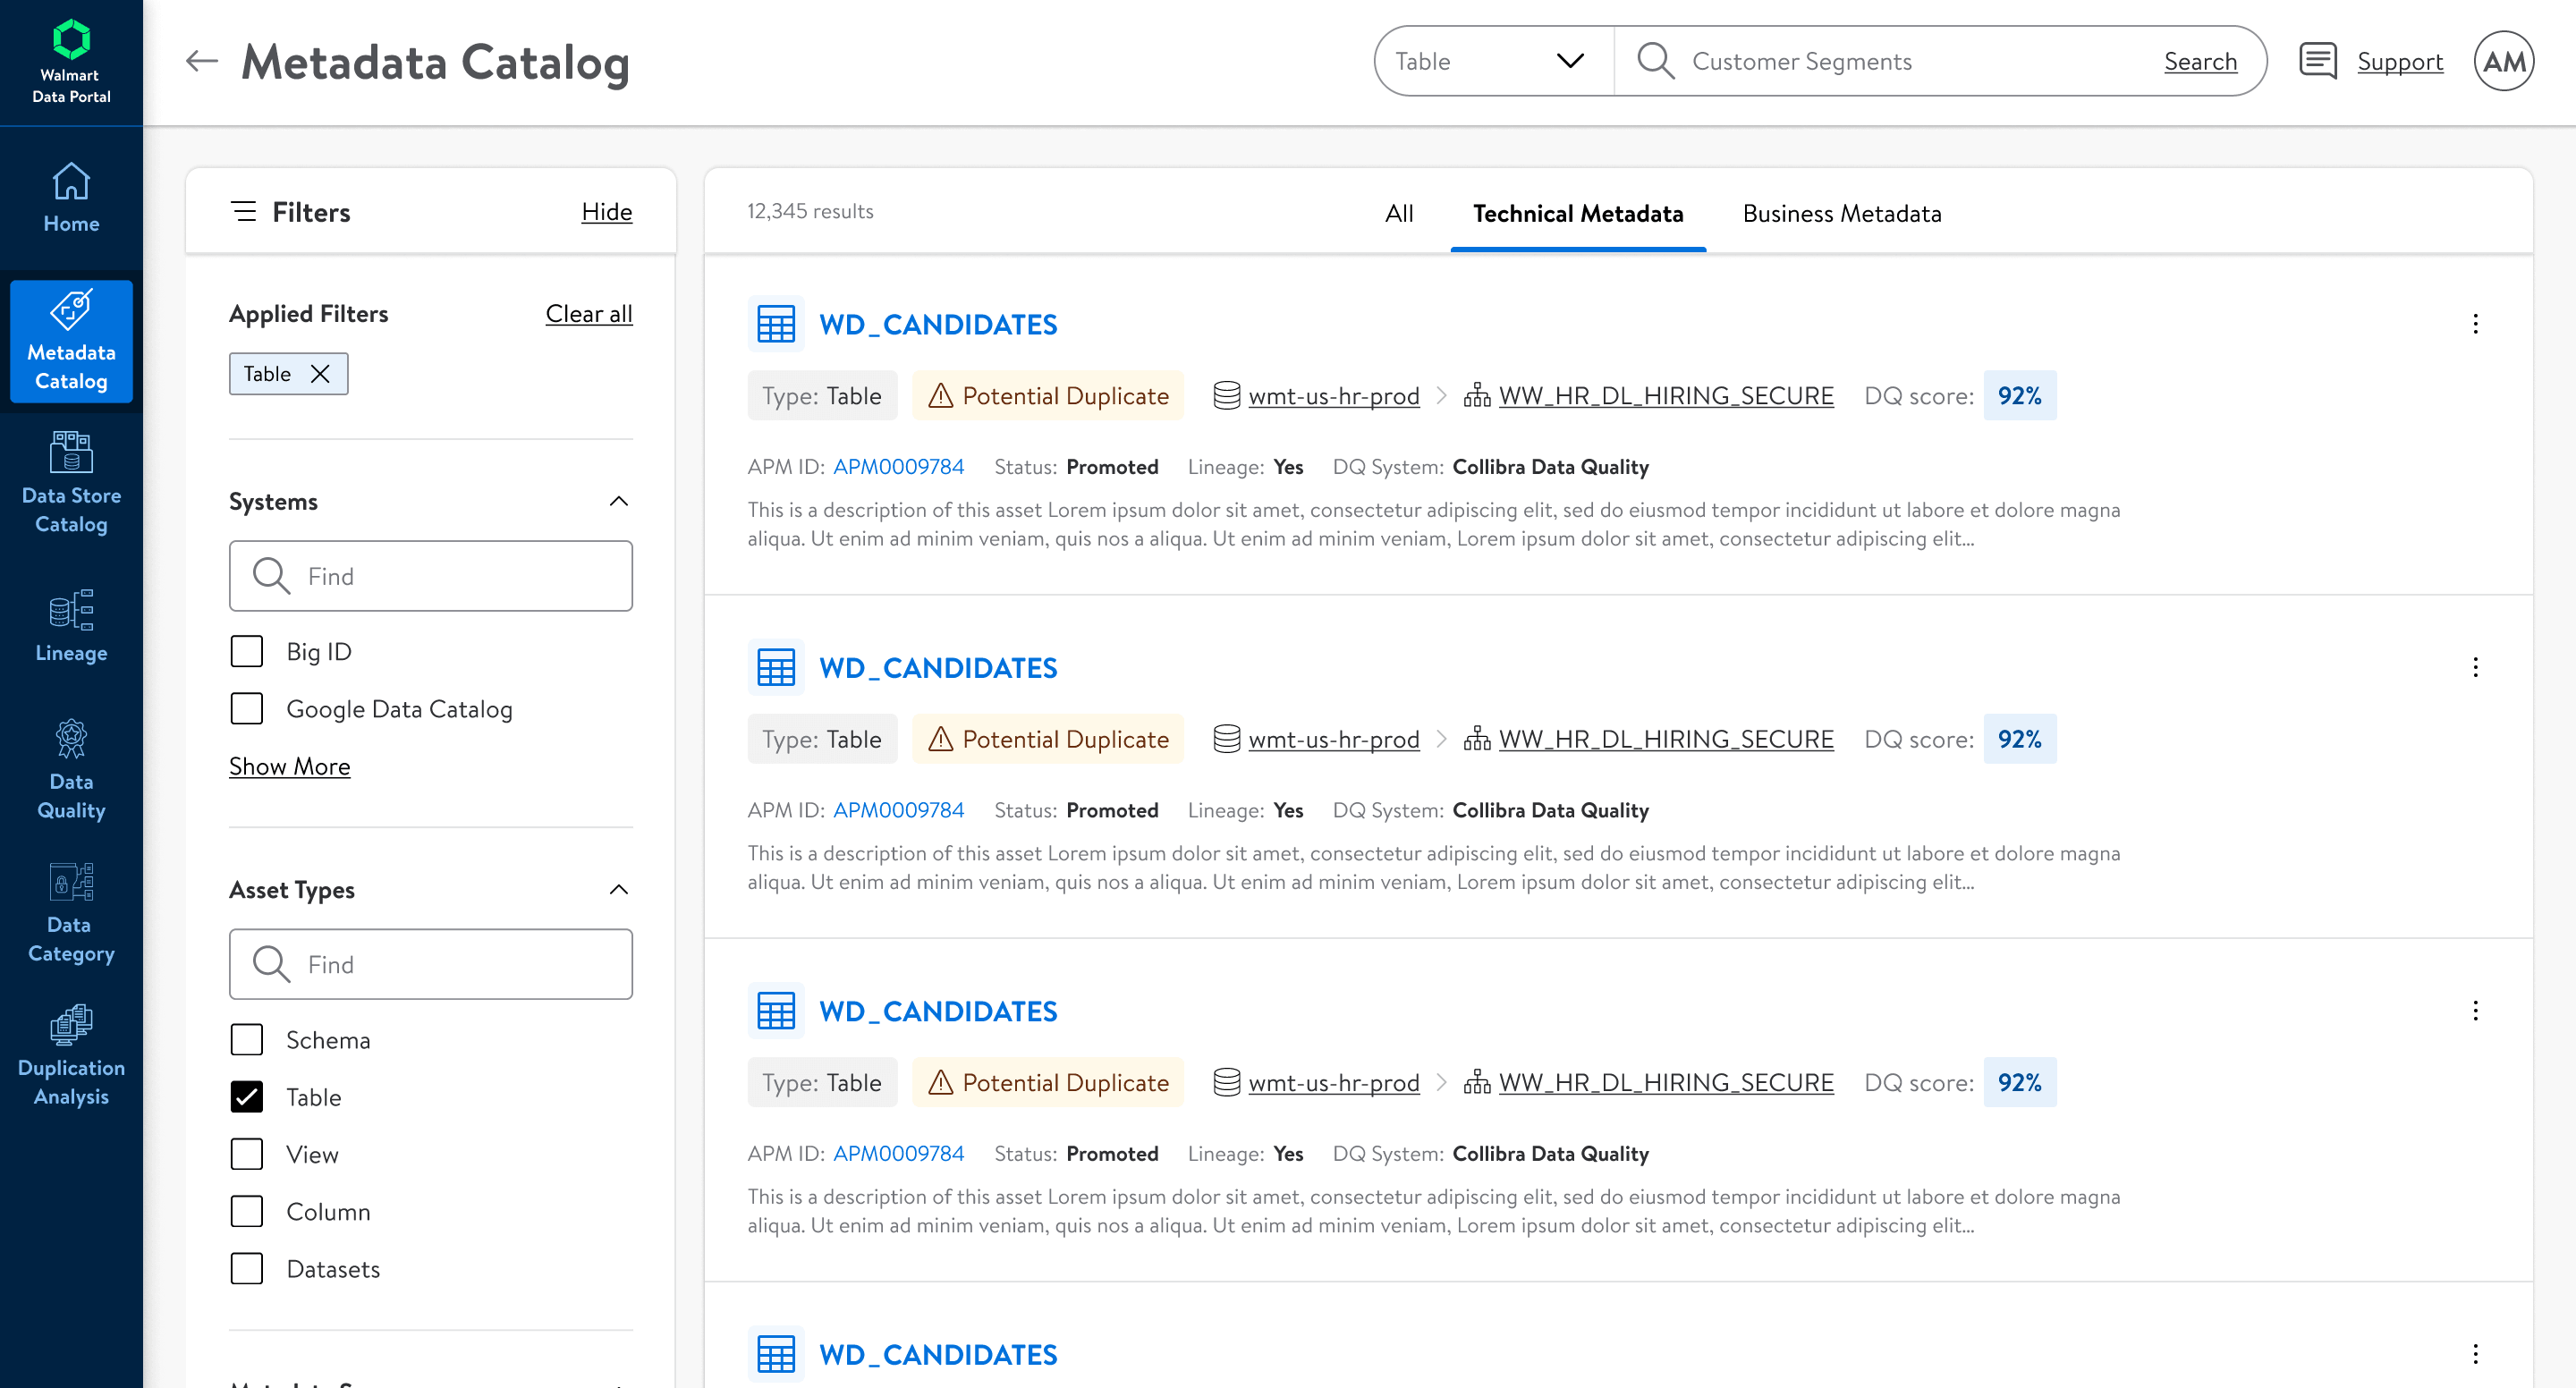
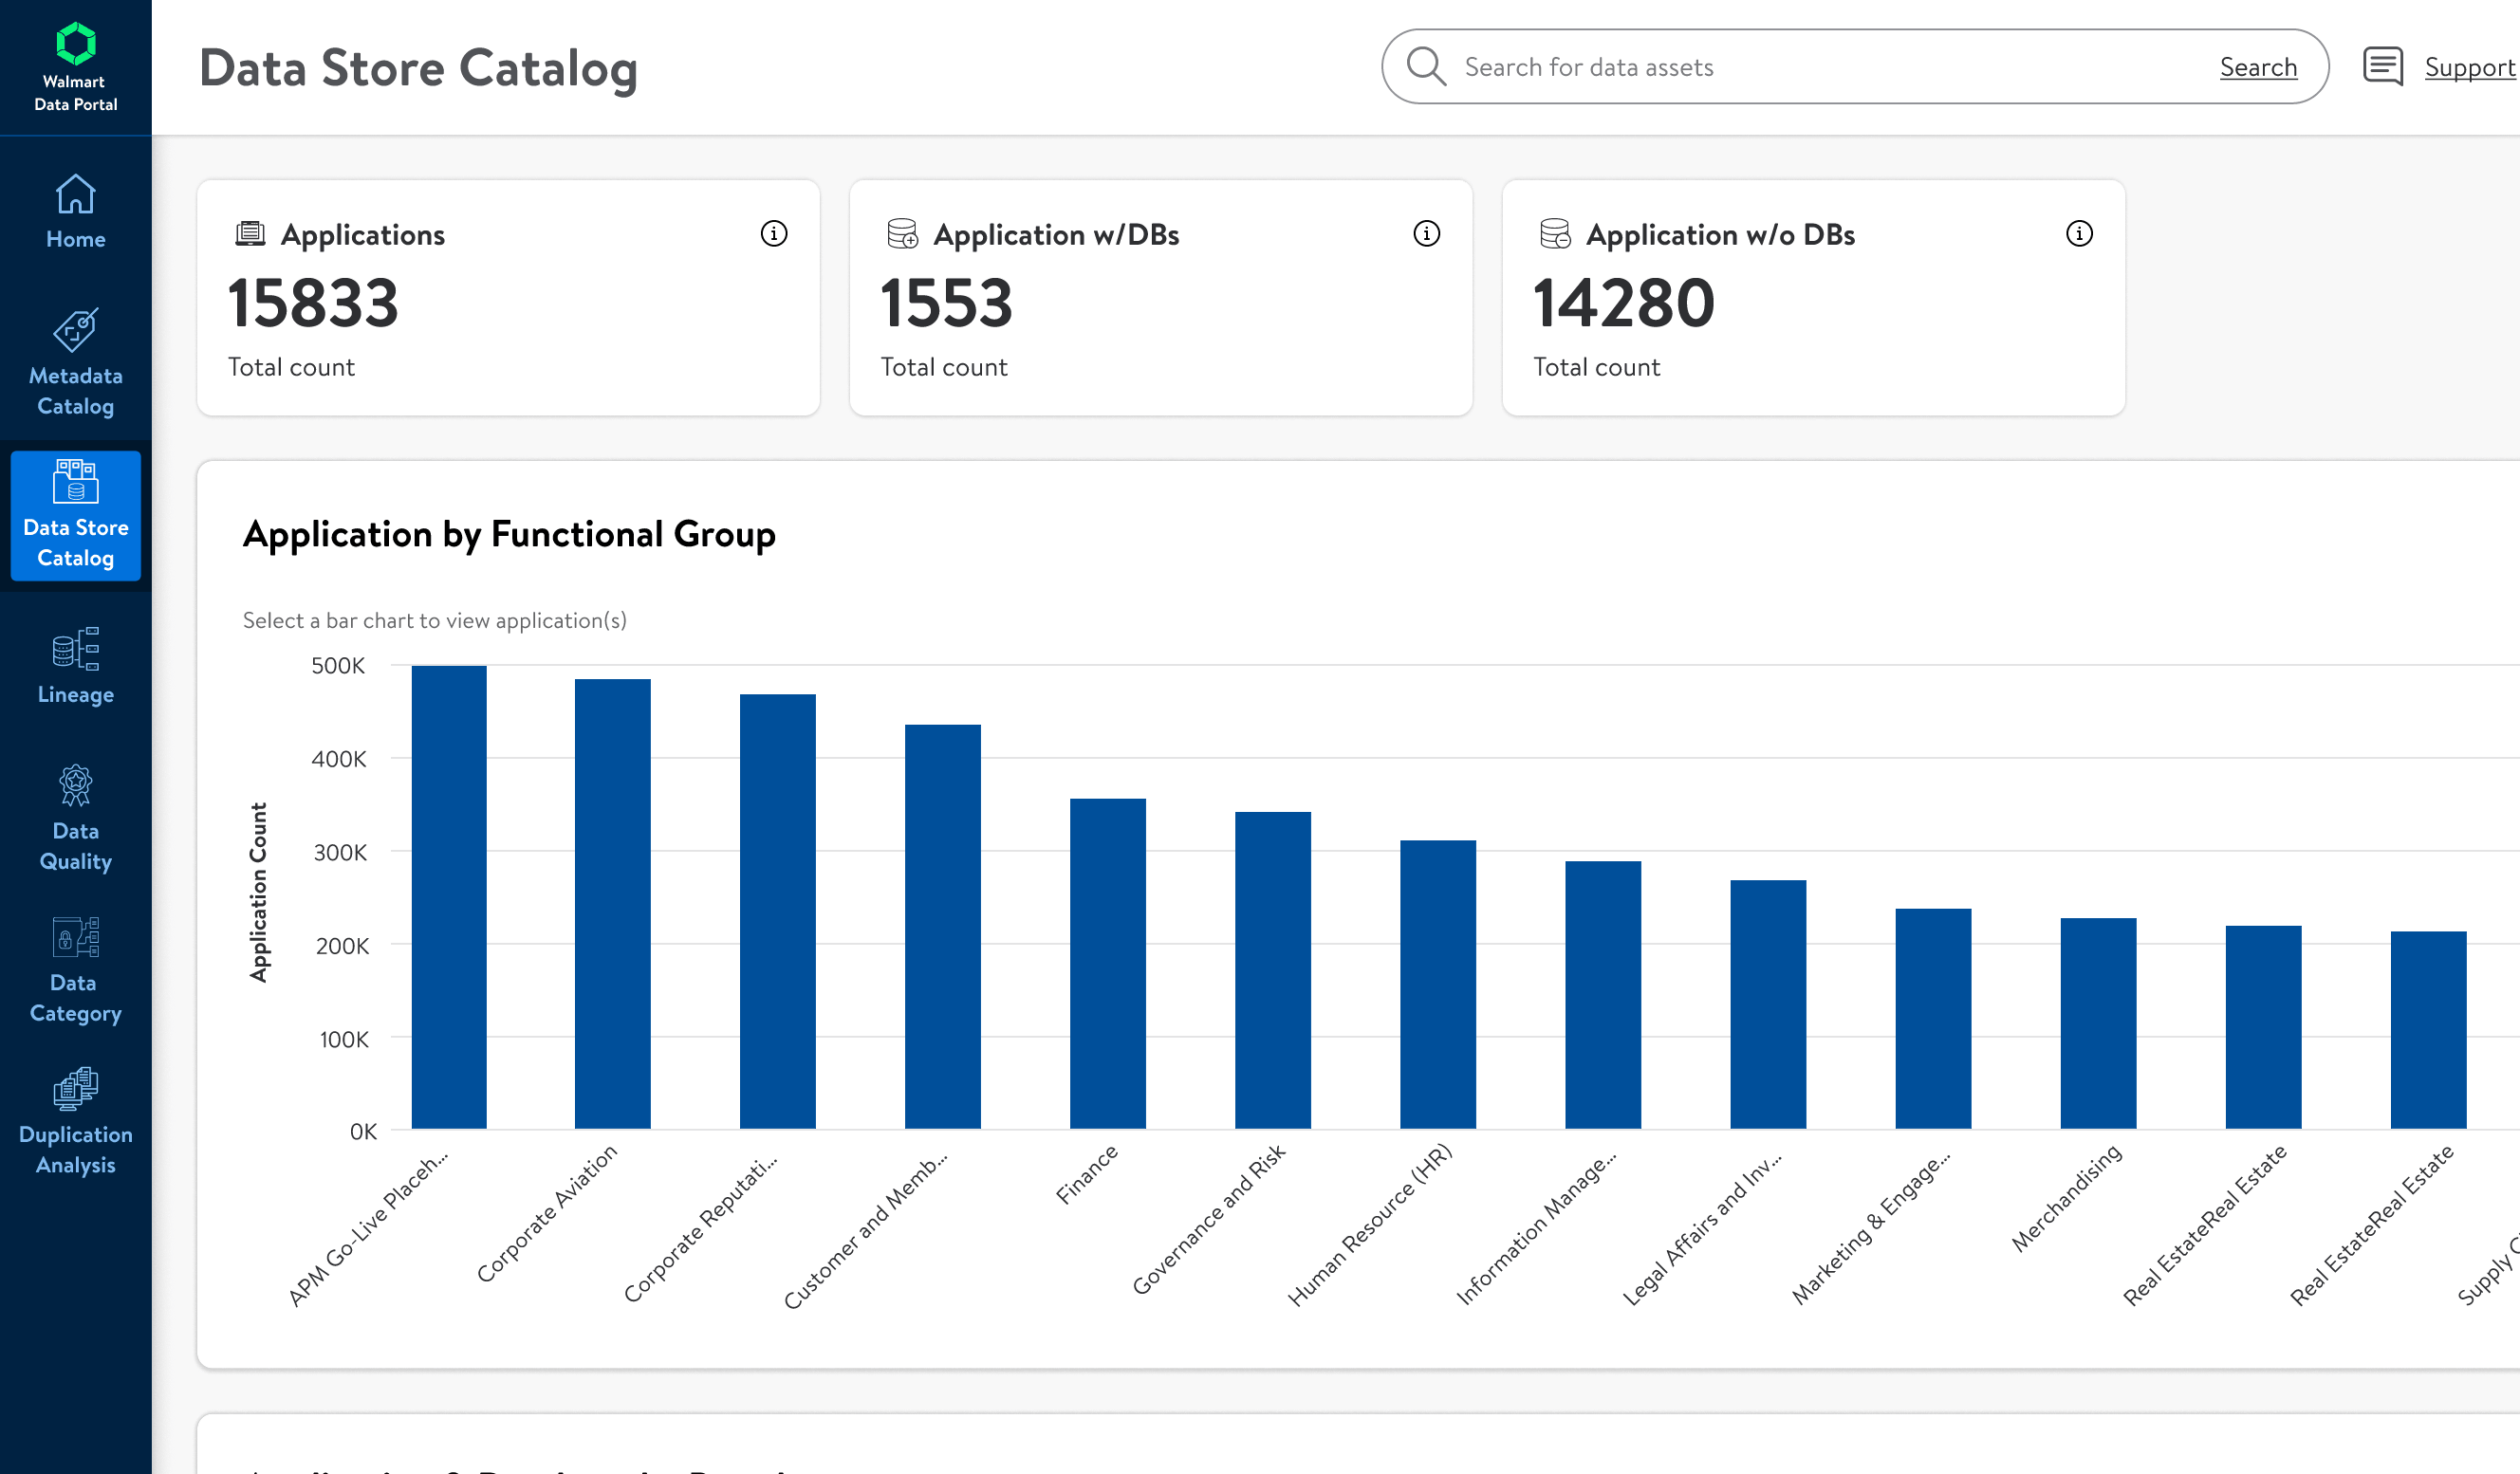
- Catalogs: The Metadata Catalog shows total assets and technical metadata counts by source, so users can see at a glance how much coverage BigID and Google Data Catalog each have.
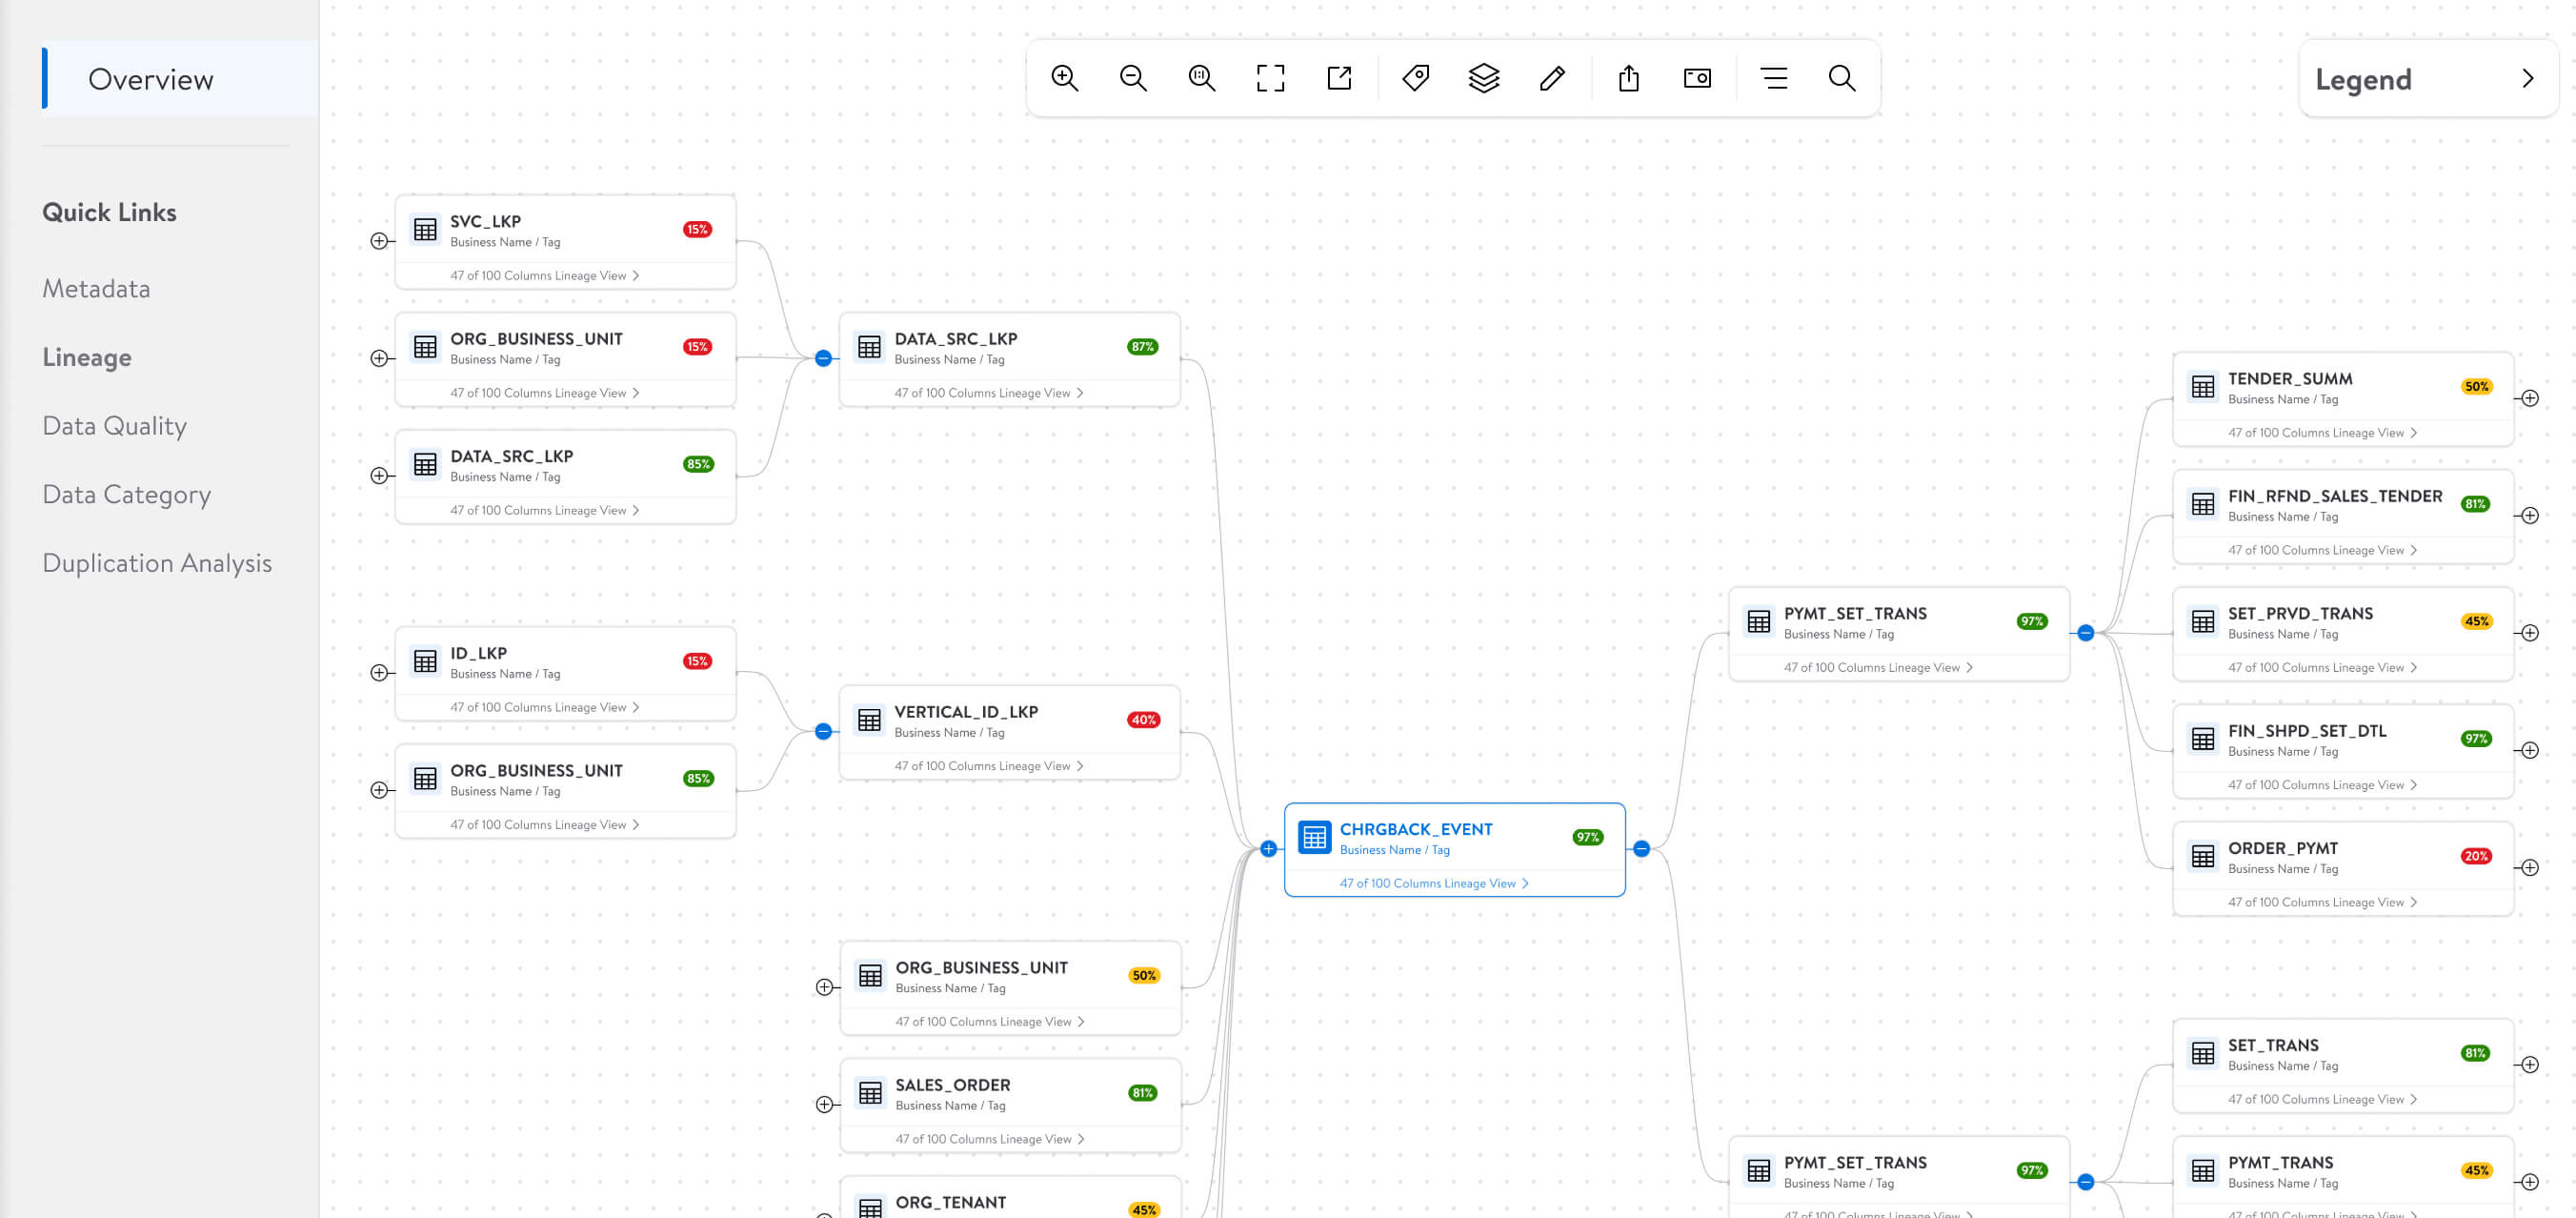
- Lineage: This is an interactive node graph. Each table is a card showing its name, source, and a colored quality badge. A green 97% badge means the data is clean; a red 15% means there’s an issue. Users can zoom, pan, expand clusters, and click into any node to see column-level Lineage.
- Data Quality: Three summary cards at the top (DQ Enabled Tables, Critical Data Elements, DQ Jobs), then bar charts showing table counts by datasource—Big Query, Postgres, Db2, Hive—and by DQ system (CDQ vs. GDQ).
- Data Category: Applied filters show as persistent chips so users always know what’s active. The main chart shows table counts by subcategory—Personal Identifiers, Device and Online Identifiers, Employment Information, etc.
- Duplication Analysis: Users can click into a specific org to see a table of database names and exact duplicate table counts.
Key Design Decisions
1. Homepage cards instead of a dense dashboard grid: Early iterations tried to show too much on the home page—recent activity, favorite tables, system status, announcements. It felt like a cockpit. I moved to a simple greeting, search, and six module cards. The click-through rate to catalogs went up because people weren’t paralyzed by choice.
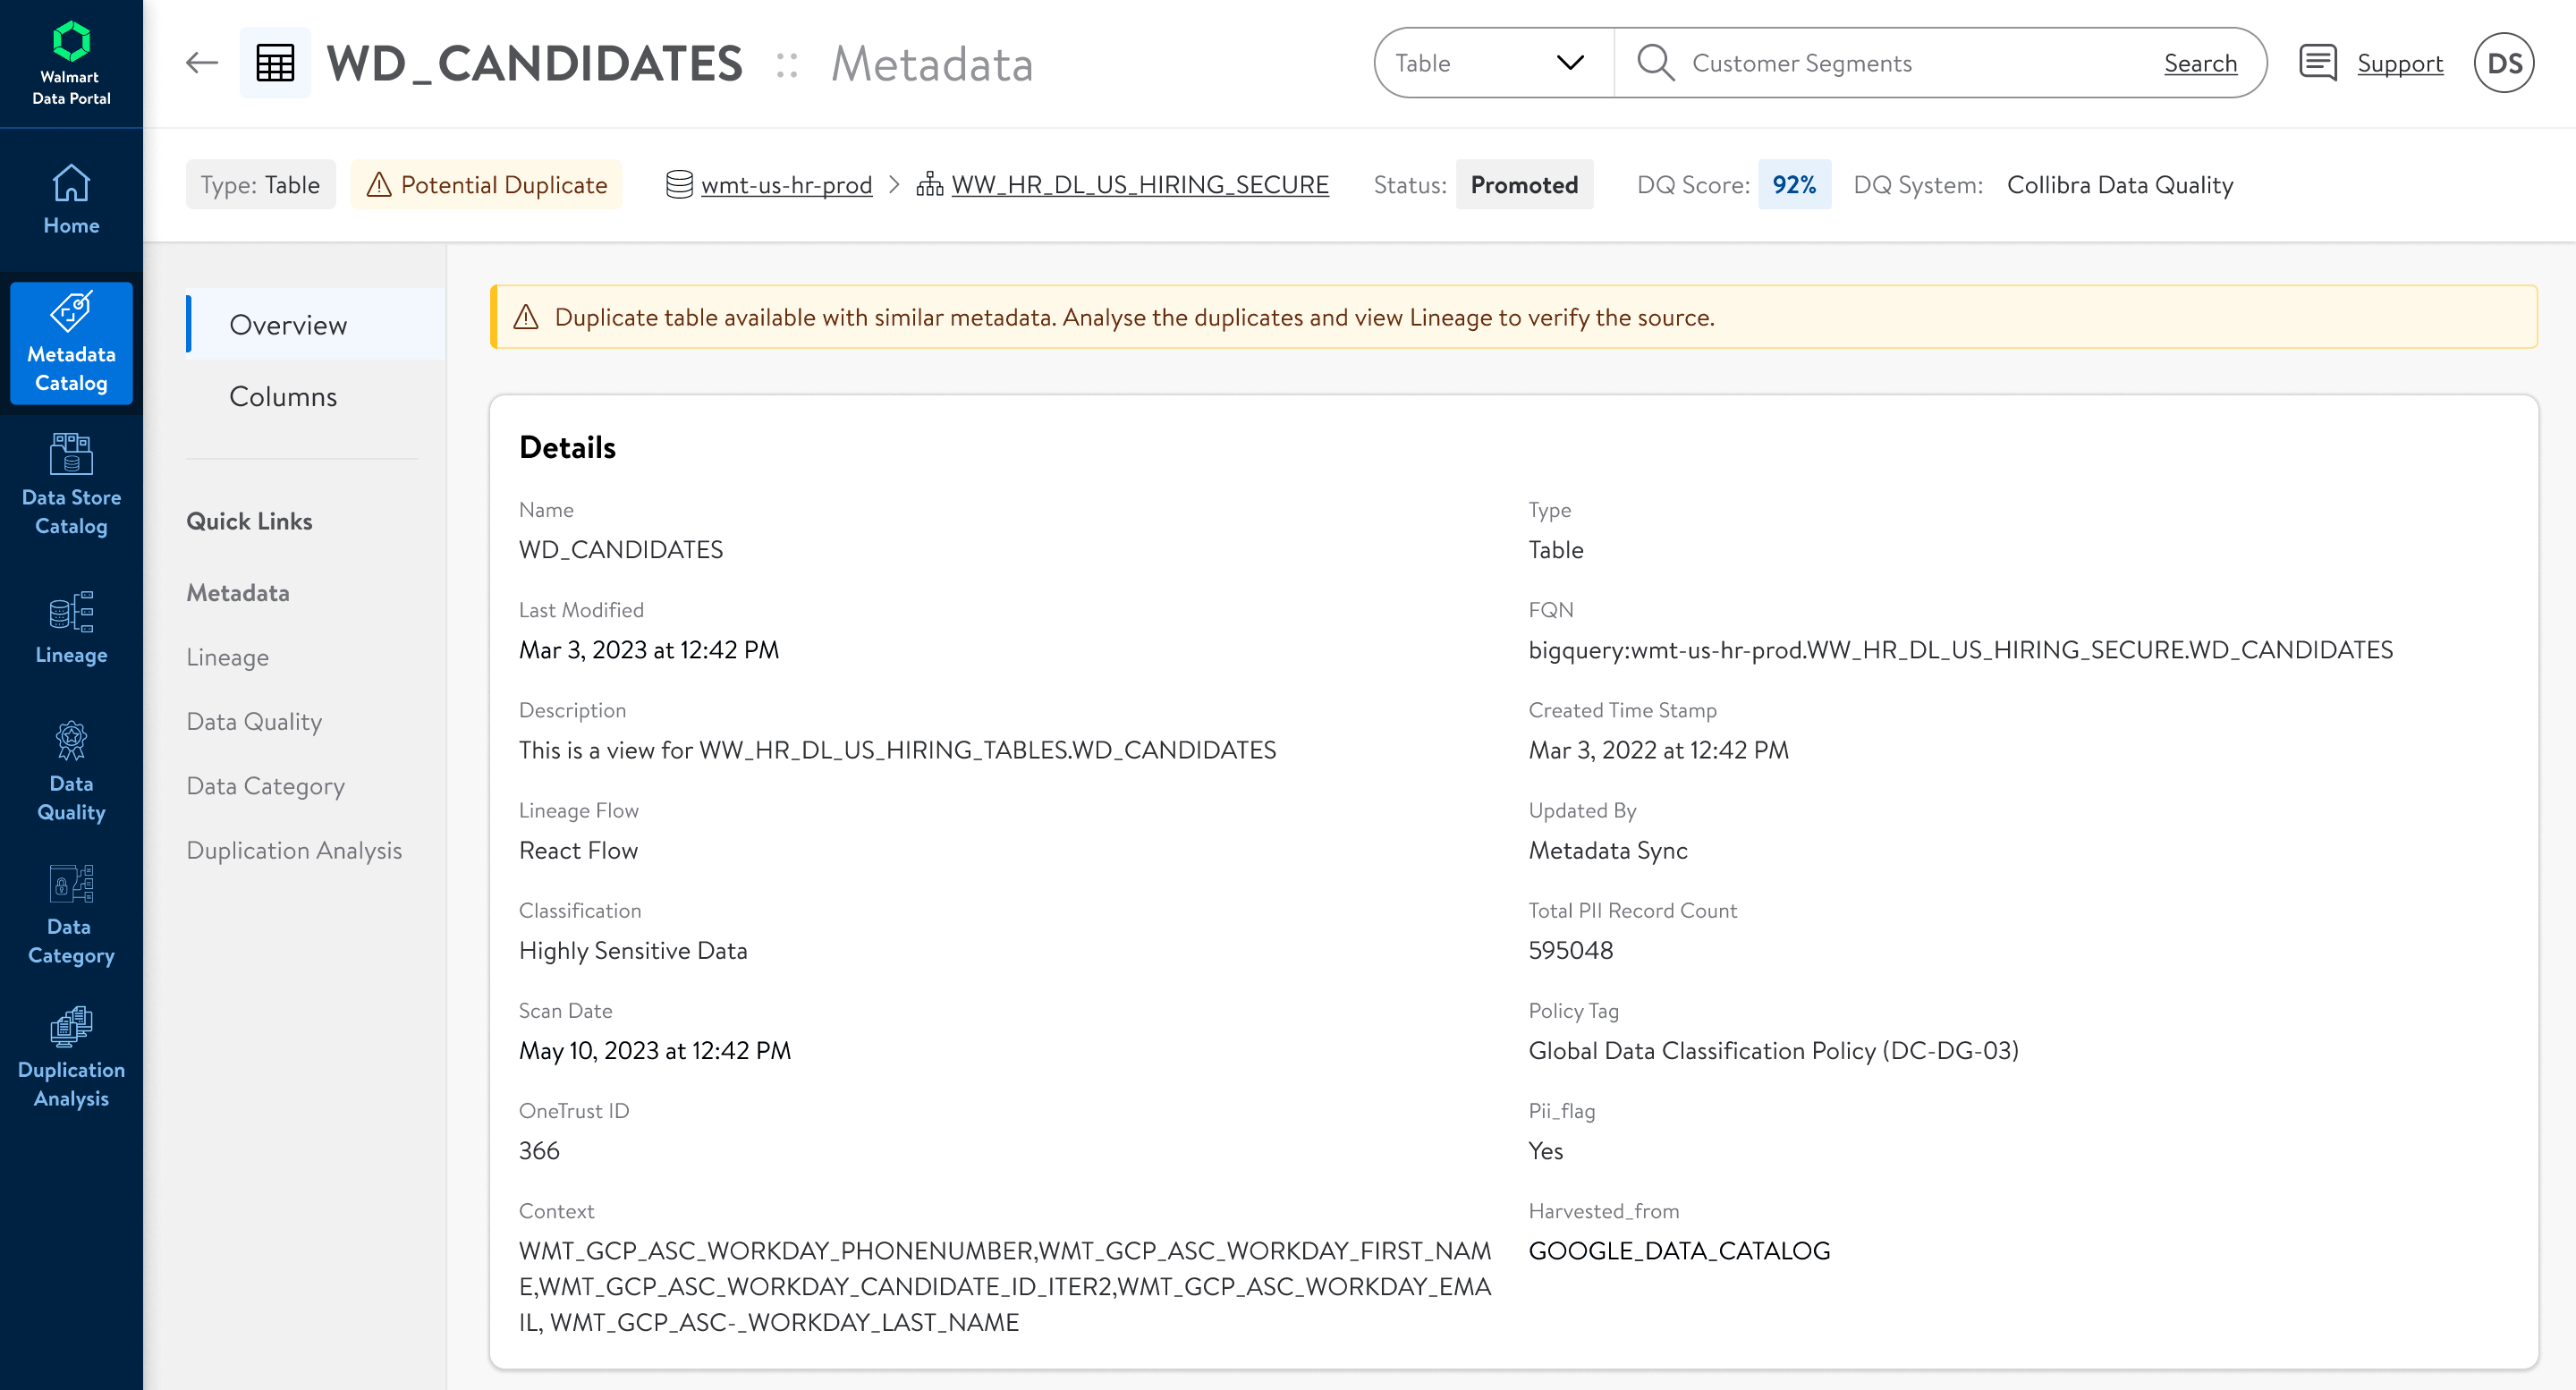
2. “My Last Searches”: This came directly from watching analysts. They were searching for the same tables—WD_CANDIDATES, CHRGBACK_EVENT—multiple times a day. Adding a quick history section saved them from retyping.
3. Quality badges on lineage nodes: Before, lineage answered “where did this come from?” Now it also answers “can I trust it?” I put the DQ score directly on each node card using color coding: green for high scores, yellow for medium, red for low. Engineers told me this changed how they debugged issues; they could spot the broken upstream table visually instead of clicking through every node.
4. Progressive disclosure in lineage graphs: The first version of lineage tried to render everything at once. Past about 20 nodes, it became spaghetti. I added expand/collapse controls on clusters and defaulted to a simplified view. Users drill in only when they need to.
5. Persistent filter chips: In Data Category and Duplication Analysis, users stack multiple filters. I made sure applied filters appear as removable chips at the top of the results. The original design reset everything when you changed one dropdown, and people lost their place constantly.
6. Standardized chart patterns: Across Metadata Catalog, Data Quality, and Duplication Analysis, I used the same bar chart style: sorted descending, consistent blue palette, horizontal labels where possible. It sounds small, but when users are bouncing between modules, that consistency makes the data easier to scan.
What I Learned
Scale forces you to hide things. My instinct is always to give users more context, but when you’re dealing with 124,000 databases, showing everything is the same as showing nothing. I had to get comfortable designing views that intentionally hold information back until the user asks for it.
Lineage is harder than it looks. I went through four major iterations on the graph view. The “pretty” version with curved lines and full labels broke down at 50+ nodes. We ended up with a more utilitarian card-and-line approach that actually holds up in production.
Internal tools deserve real craft. It’s easy to treat internal portals as second-class compared to consumer products, but these users spend hours a day in this tool. The “Promote Tables to DGC” shortcut and the “My Last Searches” module were tiny additions, but they saved real time for people who were previously copying table names into Excel and re-uploading them.
Different users, same page. Analysts and governance teams use the same search bar but want completely different things. I learned to design for the common case (fast table lookup) while making advanced filtering discoverable but not in the way.
If I did it again: I’d push harder for a better tablet experience. Engineers on call would love to pull up lineage on a mobile device during an incident, but we never prioritized responsive layouts. And I’d explore a hybrid list + graph view for lineage—the canvas still gets crowded when you’re looking at enterprise-scale pipelines.